Structural Analysis and Stability – Asymmetrically Propped Structures
![[object Object]](/_next/image?url=%2Fimages%2Fauthors%2Fsean_carroll.png&w=256&q=75)
Structural Analysis and Stability – Asymmetrically Propped Structures
In the previous post in this two part series, we considered a multi-storey structure in which the stability elements were placed symmetrically within the floor plan. If you haven’t read that post, I suggest going back and starting there. In that case, when considered on a 2D plan from above, the centre of mass for the structure (the point through which the resultant wind loading acts) is coincident with the centre of stiffness. So, the loading is being applied through both the centre of mass and the centre of stiffness. When force passes through the centre of stiffness of any structure, only translation of that structure will occur, i.e. no rotation occurs.
However, if the stabilising elements are not placed symmetrically (much more realistic!), the centre of stiffness may no longer be coincident with the centre of mass. As a result, twisting or rotation of the structure occurs, about the centre of stiffness. So, our analysis must determine forces transmitted to the stabilising elements due to:
- linear translation of the structure along the line of action of the external force
- rotation of the structure about the centre of stiffness. If we assume small magnitude deflections, these rotations can be resolved into linear translations (which we will discuss below).
To work our way through this analysis we will consider the following amendments to the stabilising elements in last post:
- Shear wall B shortened from the south by 5 m
- The core moved west by 4 m and north by 3 m.
These amendments can be seen below. For this analysis let’s assume the design wind loading is from the south.
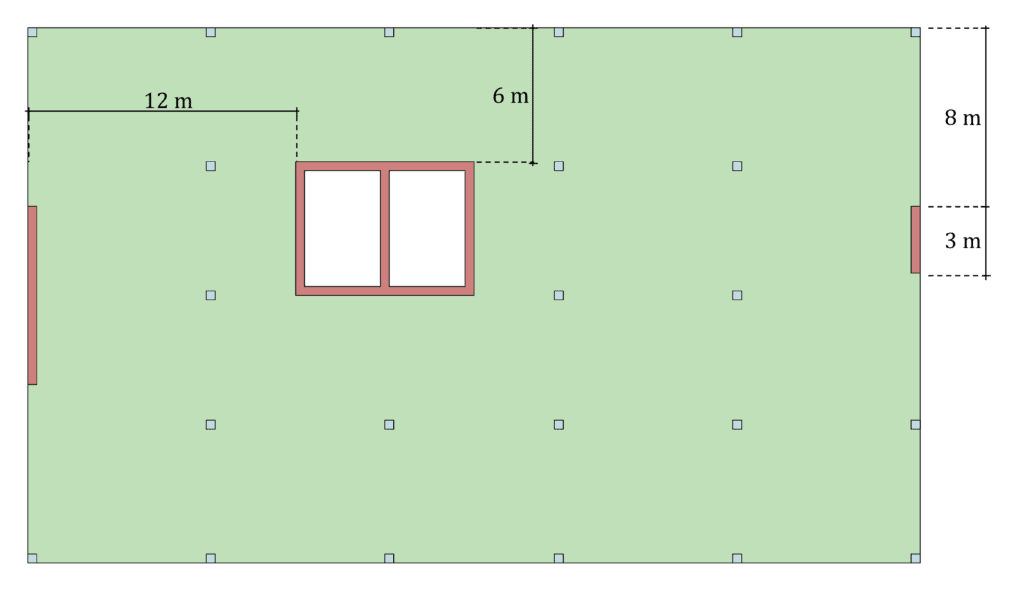
Fig 1. Asymmetrically stabilised structure
Locating the centre of stiffness (CoS)
The fact that the line of action of the resultant wind load no-longer passes through the CoS, means a torque or moment is induced. To evaluate this moment we must first locate the CoS. This can be done by taking the sum of the ‘moments of stiffness‘ (analogous to taking the sum of the moments of a set of forces) about a convenient set of axes. For our calculations we will take the southern and western edges of the floor plate as our x and y axes respectively. We can start by summarising the relative stiffness of each element in both the x (east-west) and y (north-south) direction:
Taking moments about y-axis to determine the x-coordinate of the CoS
The x-coordinate of the CoS, is obtained from the following equation:
Putting this equation into action we can determine the x-coordinate of the CoS:
Intuitively this makes sense if we think about the stiffer shear wall A ‘dragging‘ the centre of stiffness to left of the core. The less stiff shear wall B is unable to fully balance the effect.
Taking moments about x-axis to determine the y-coordinate of the CoS
Based on our previous discussion of the shear wall stiffness in the east-west direction we can see by inspection that they will have negligible influence in the CoS y-coordinate, so we would expect to see the CoS in the y-direction lie in the centre of the core, 15 m from the southern edge of the floor plate. We can confirm this as follows:
A revised sketch of the floor plate helps visualise our progress so far,
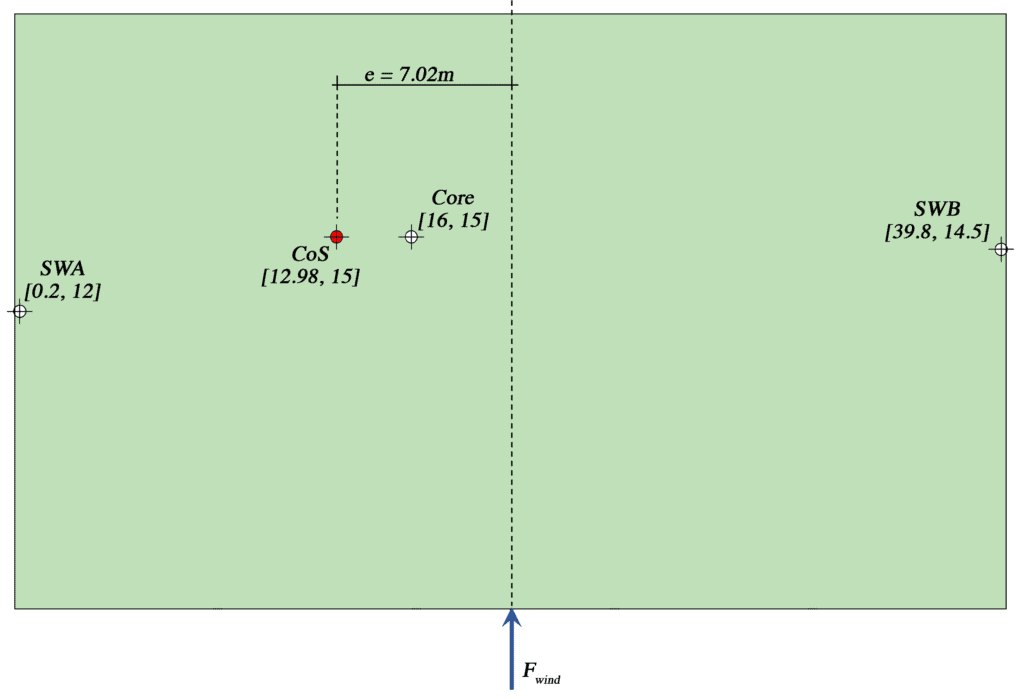
Fig 2. Floor plate showing individual element CoS and combined CoS for the structure with coordinates in square brackets.
The asymmetrical arrangement of stability elements induces a moment, , given by:
This moment induces a twisting of the structure. The task now is to determine the corresponding force transmitted into each stability element by this twisting effect.
Forces due to rotation
Consider a rotation through radians about some arbitrary CoS. At a radius from the CoS, the circumferential displacement is denoted by .
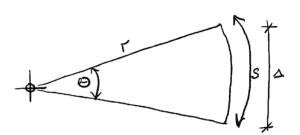
Fig 3. Displacement resulting from rotation through an angle
However, for small angles, the linear displacement , is approximately equal to . Thus we have:
We know from Hooke’s Law that the force that develops in an element , is the product of the element’s stiffness and displacement, , therefore using equation (3), we have:
Now, the moment of resistance offered by in response to an externally applied moment is:
Since there must be moment equilibrium, i.e. the externally applied moment about the CoS, , must be balanced by the individual moments generated by the forces developed in each stability element, , we have,
Rearranging we have,
Substituting equation (6) into equation (5) and rearranging, we obtain the component of force developed in each stability element as a result of the eccentrically applied external wind force (and the moment that creates):
Evaluating total force transmitted
Returning to our analysis, the calculation procedure hereafter is best summarised in a table, Tb. ??. Note that element stiffness, denoted as in equation (7) is replaced with our more familiar relative stiffness .
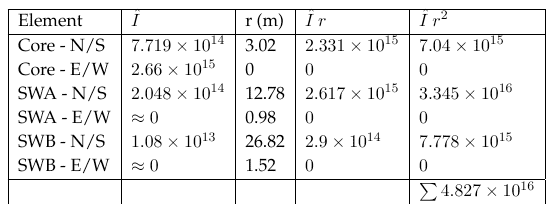
Fig 4. Table to determine the distribution of forces due to rotation of the structure.
The force distributed into each stability element is calculated as the combination of force due to translation and rotation . For all elements, will act in the direction of the external wind load. We will call this sense of force direction positive. However the sense of will depend on the overall sense of rotation and the position of each element relative to the CoS. So, the core and shear wall B experiences a positive force while shear wall A experiences a negative force. Noting that , the total force on each element is calculated as follows.
These force components are represented graphically below. Pay particular attention to the orientation of the rotational force components.
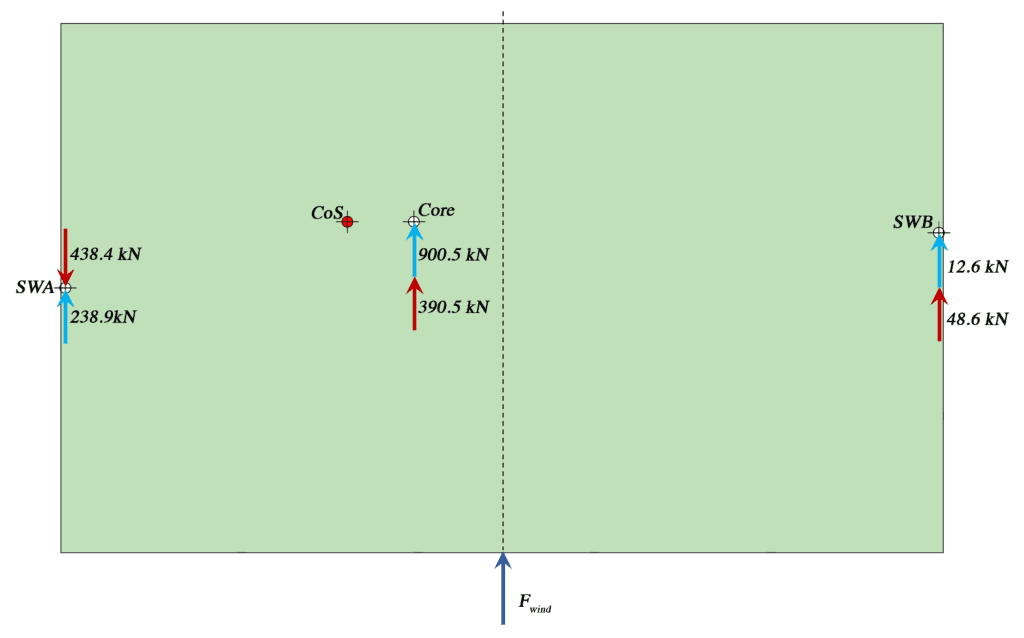
Fig 5. Forces transmitted into stabilising elements due to translation and rotation of the structure – wind from the south.
For completeness we can repeat the procedure, this time considering wind approaching from the east. We note that the total wind loading acting on the eastern facade is 691.2 kN. The resultant of this force will act at the mid-point of the eastern facade. As a result, the lever arm about the CoS is 3 m, producing a clockwise moment of kNm. Remember that the shear walls provide no resistance to loading in this direction, so the full wind load is transmitted into the core. The components of force transmitted due to rotation are calculated as follows:
These force components can again be represented graphically,
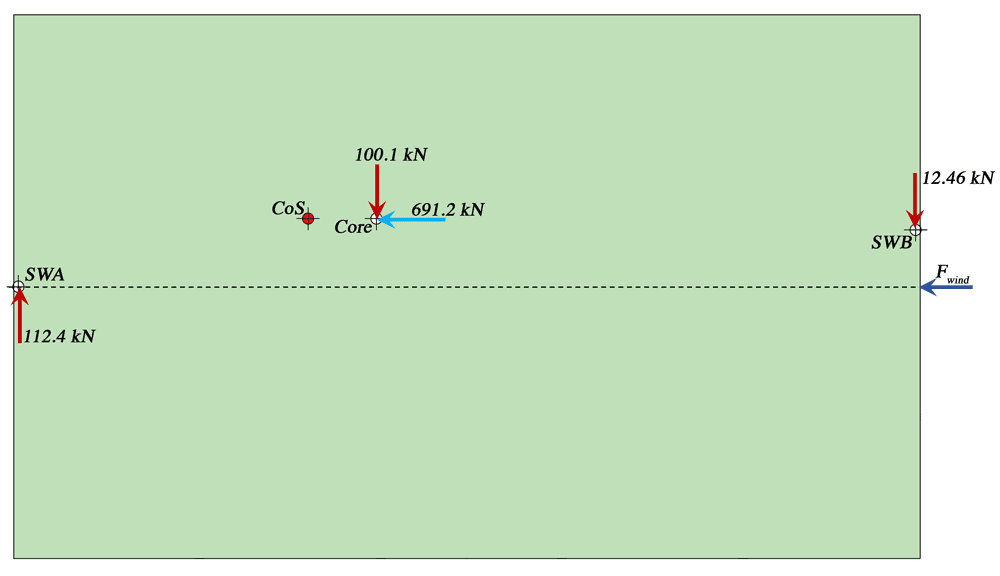
Fig 6. Forces transmitted into stabilising elements due to translation and rotation of the structure – wind from the east.
Wall Stresses and Model Validation
We can evaluate the normal stresses that develop in each stability element following the procedure outlined previously using the engineer’s bending equation. To conclude our discussion we will evaluate the stresses that develop in shear wall B as a result of wind from the south. Finally, we will compare the results from our simplified hand analysis with those derived from a finite element computer model of the structure to gauge their accuracy.
Normal stresses due to bending of shear wall B
Our analysis has indicated that shear wall B resists 61.2 kN of the external wind loading. By following the same procedure outlined previously, we can determine that the lateral load transmitted by a typical floor, kN. The load transmitted by the roof slab is therefore kN. Thus the bending moment at the base of the wall evaluates to 802.2 kNm. If we assume that the wall bends about a neutral axis that passes through the centroid of the wall cross section, then mm and can be easily evaluated as:
The maximum values of axial or normal stress that develop at the base of the wall can therefore be estimated as:
This value is significantly higher than we observed for a symmetrical arrangement of stability elements. This is due to the fact that our structure now experiences torsion which induces additional forces in the wall. Shear wall B has also been reduced in depth from 8 m to 3 m. This means that for a given magnitude of applied loading, it will develop larger stresses than a deeper wall subjected to the same force.
Finite Element Analysis
The same task completed above can be carried out using an alternative method of analysis known as finite element analysis. The details of this analysis method are beyond the scope of this post, however we can summarise by saying it is an analysis technique easily implemented using computer algorithms. As such, it is synonymous with analysis software. A well constructed FE model will often give more accurate results in a shorter time and be easily modified allowing for iterative analysis and design.
A word of caution at this point; FE analysis and computer analysis in general is not a substitute for having a solid understanding of the physics and mechanics of a given problem. A good engineer should always have the ability to reduce any problem to a simplified model suitable for hand analysis methods. That said, in a commercial environment, engineers must also be comfortable with computerised methods of analysis and design.
The following analysis was performed in Autodesk Fusion 360. This is a cloud based 3D modelling and analysis package. If you’re a student you likely have access to this software free of charge. Autodesk’s own tutorial material is excellent.
The image below shows a set of results indicating the qualitative deflection of the structure when wind loading is applied from the south as in our discussion above. The magnitude of deflection has been exaggerated to make it more visible in the deflected shape diagrams, (c) and (d). The heat map indicates the relative magnitude of deflection across the structure from dark blue (no deflection) to red (maximum deflection). As we would expect, deflection at the base of the walls is zero and this increases as we move vertically up through the structure (a-c). The counter-clockwise rotation of the structure is also evident, particularly when viewed from above (d).
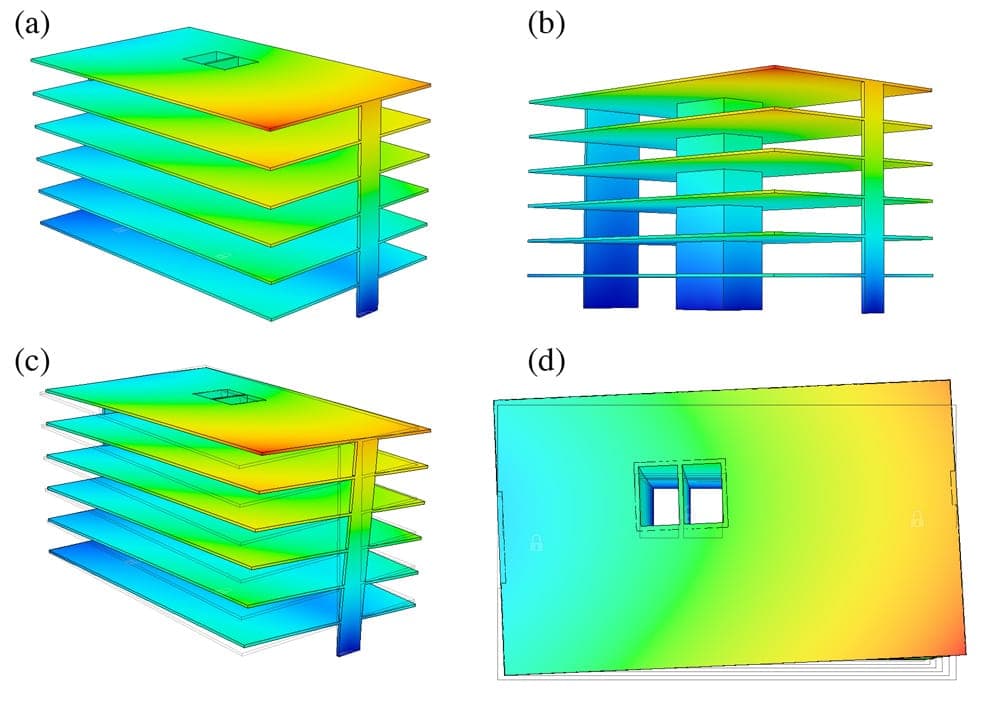
Fig 7. (a & b) Isometric views of the undeformed structure with relative deflection indicated by a heat map. (c) Isometric view showing a heap map on top of the deformed structure. (d) Plan view of the deformed structure with heat map emphasising the rotation of the structure about a CoS.
Is should be noted that in order to determine an accurate estimate of the absolute deflection of the structure, we would need to provide the software with an accurate estimate of the secant modulus for the concrete. This is approximately analogous to Young’s modulus and is quite difficult to accurately estimate. For this reason we are not going to focus on the actual magnitude of the deflection in this analysis. In a real world design you certainly would want to estimate the deflection.
In the image below we can see how the stresses are distributed within the structure. Image (a) shows the full stress range mapped onto the structure. As expected the largest stresses occur in the vertical stability elements. Imaged (b-d) show successively larger magnitudes of stress removed from the heat-map, leaving only higher magnitudes of stress indicated by the heat map. This allows us to emphasis the areas where the stress is at its highest, at the base of the walls.
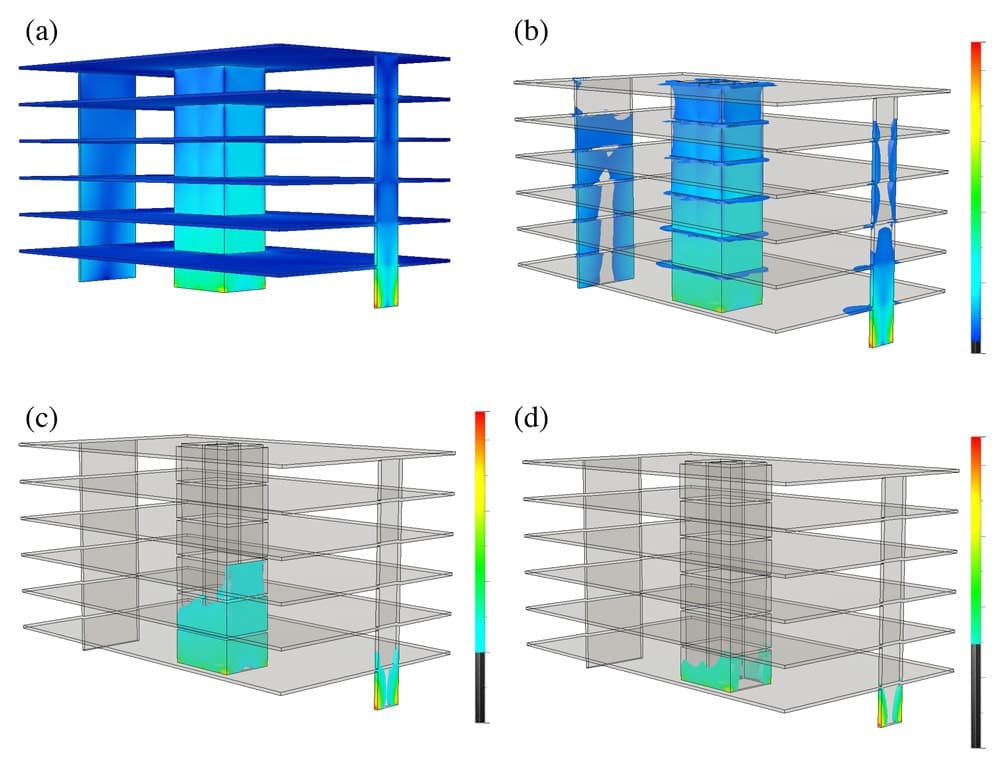
Fig 8. (a) heat map indicating magnitudes of Von Mises stress across the structure. (b-d) heat map with successively larger magnitudes of stress removed for clarity.
The stress depicted in the images above is called Von Mises stress. All we’re concerned with in this visualisation is the qualitative information it provides, i.e. the relative magnitude and location of stresses in the structure. We can clearly see that the core and shear wall A are undergoing the most stress. Shear wall A in particular is developing relatively high levels of stress. As mentioned above, this is due to its smaller depth and its relatively large distance away from the CoS. This means it undergoes large translations as a result of the rotation of the structure.
The image below shows us another stress heat map. However the stress indicated is the normal stress in the vertical direction. This is the stress that we have approximated in our hand calculation. We can see that our FE analysis indicates a maximum normal stress at the base of shear wall A of 1.6 N/mm. This is in relatively good agreement with our approximation of 1.34 N/mm. The negative stress on the right hand side of the wall is indicating compression with the positive stress indicating compression where we would expect to see it.
When we consider that both estimates of maximum stress have been determined using very different methods, the level of agreement is quite good. In reality, having an FE model is helpful as it allows for relatively rapid design iterations to be performed, compared to running our hand analysis for every iteration. Having said that, it is good to see that straightforward hand analysis techniques can provide quite accurate results, even if a little more time-consuming to complete.
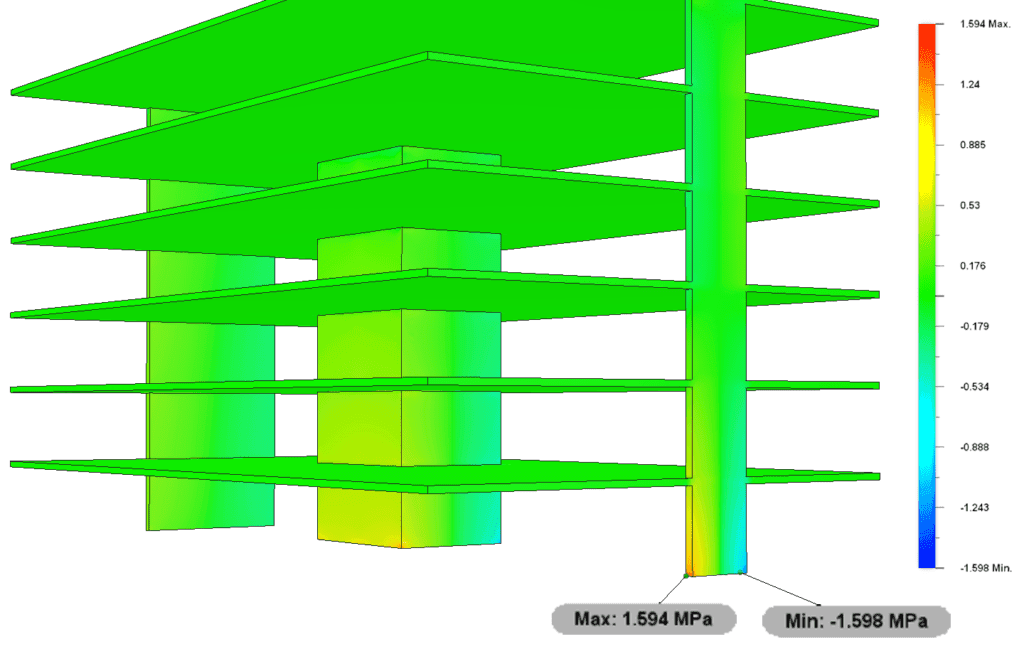
Heat map showing normal stress in the vertical direction with maximum stress magnitude equal to .
Dr Seán Carroll's latest courses.


Featured Tutorials and Guides
If you found this tutorial helpful, you might enjoy some of these other tutorials.
Steel Column Design using Eurocode 3 - A Complete Guide
Learn how to design steel columns subject to compression and biaxial bending.

Callum Wilson
Parametric Graphic Statics with GeoGebra
Increase the precision and speed of your analyses with parametric graphic statics.

Prof Edmond Saliklis


